

Postini spam graph from Jan 2006 to Jul 2007
Tags :spam postini
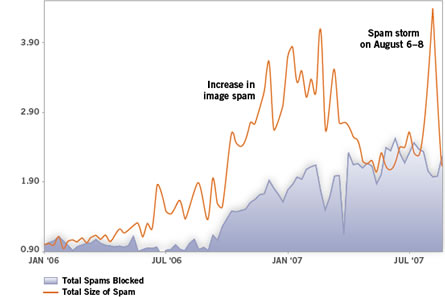
Spam size vs. spam blocked
Weekly data, normalized to January 1, 2006=1.00
Weekly data, normalized to January 1, 2006=1.00
In 2006, spam size increased at a dramatic rate caused by an increase in image spam. By February of 2007, spam size peaked at over 400% of what it had been in January of 2006. After the February 2007 peak, a decline in image spam caused a decline in the spam size growth. However, the summer has reversed that trend with an increase of spam with pdf and xls attachments. During the three days between August 6-8, 2007, we experienced another upsurge in total spam size, up 67% (in the peak of the three day period) from August 1. This was primarily due to a massive pump and dump scam that used a pdf file attachment.
Viruses also had an increase with the largest outbreak in over 2 years just happening in August 2007.
blog comments powered by Disqus
On Monday, September 17th, 2007 by Chris Miller


